
Red Cell Distribution Width (RDW): The Overlooked Marker That Predicts Mortality, Inflammation, and Nutritional Deficiencies
Your complete blood count shows hemoglobin at 14.8 g/dL—normal. Hematocrit at 44%—normal. RBC count at 4.9 million/μL—normal. Your doctor says everything looks great and moves on.
But your RDW is 16.2%—elevated above the normal range of 11.5-14.5%. Nobody mentioned it because most doctors don’t pay attention to RDW. It’s just another number on the CBC that gets ignored.
Here’s what that elevated RDW reveals: you have significant variation in red blood cell size, indicating mixed nutritional deficiencies (likely iron plus B12 or folate), early stages of chronic disease before other markers become abnormal, increased systemic inflammation affecting red blood cell production, or substantially elevated cardiovascular and all-cause mortality risk even when other markers appear “normal.”
RDW measures how much your red blood cells vary in size. It’s one of the most powerful prognostic markers in medicine—elevated RDW predicts mortality from cardiovascular disease, cancer, sepsis, and virtually every other cause better than many markers doctors obsess over. Yet it’s routinely ignored.
High performers don’t dismiss markers just because most doctors don’t understand them. They recognize that RDW provides critical early warning signals about nutritional status, inflammation, bone marrow function, and overall health status.
What Is Red Cell Distribution Width (RDW)?
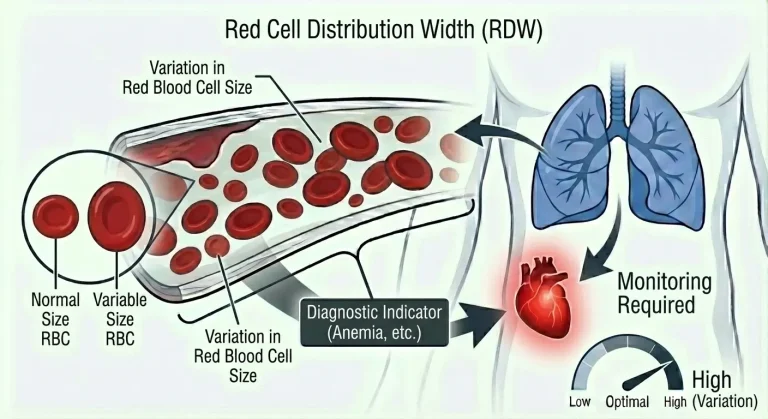
Red cell distribution width (RDW) measures the variation in red blood cell size within your blood sample. It quantifies how much your red blood cells differ from each other in volume.
In a healthy person, red blood cells are remarkably uniform in size. Most cells are very close to the mean cell volume (MCV), with minimal variation. RDW quantifies this variation using a coefficient of variation—a statistical measure of how spread out the values are around the mean.
Normal RDW range is approximately 11.5-14.5% (some labs use 11.5-15.0%). This means in a healthy person, red blood cell volumes vary by only 11.5-14.5% from the mean. The lower the RDW, the more uniform your red blood cells. The higher the RDW, the more variation exists—some cells are much larger or smaller than others.
RDW is calculated automatically by hematology analyzers when they perform a complete blood count. The analyzer measures the volume of thousands of individual red blood cells, calculates the mean (MCV), and determines how much variation exists around that mean. High RDW means substantial variation—you have a mix of different-sized cells. Low or normal RDW means cells are uniformly sized.
Why does variation in cell size matter? Because it reveals important information about red blood cell production, nutritional status, and underlying health conditions. Uniformly-sized cells suggest healthy, normal red blood cell production from bone marrow with adequate nutrients. Mixed cell sizes suggest nutritional deficiencies, bone marrow dysfunction, chronic disease, or active changes in red blood cell production.
RDW was originally just a byproduct of automated cell counting—a number the machine calculated but nobody thought much about. Over the past 15-20 years, extensive research has revealed that RDW is actually one of the most powerful prognostic markers in medicine. Elevated RDW predicts mortality and adverse outcomes across virtually every disease category studied.
Why RDW Matters: The Mortality Connection
The most striking finding about RDW is its relationship to mortality. Elevated RDW consistently predicts death from cardiovascular disease, cancer, infections, pulmonary disease, kidney disease, liver disease, and all causes combined—even after adjusting for other risk factors.
Large population studies have demonstrated this relationship repeatedly. A study of over 15,000 adults in the National Health and Nutrition Examination Survey (NHANES) found that elevated RDW was associated with significantly increased all-cause mortality. Each 1% increase in RDW was associated with approximately 14% increased mortality risk. People with RDW above 14.5% had substantially higher mortality than those below 13.0%, independent of age, sex, race, hemoglobin, and other factors.
Cardiovascular mortality shows particularly strong associations with RDW. Studies of patients with heart failure show RDW is one of the most powerful predictors of mortality—better than many established cardiac risk markers. Elevated RDW predicts death and major adverse events in patients with coronary artery disease, acute coronary syndrome (heart attack), stroke, and peripheral artery disease.
Cancer mortality correlates with RDW across multiple cancer types. Patients with colorectal cancer, lung cancer, gastric cancer, and many other malignancies show worse survival with elevated RDW. The association persists after adjusting for cancer stage and other prognostic factors.
Critically ill patients with sepsis, pneumonia, or other severe infections show dramatically higher mortality with elevated RDW. ICU patients with high RDW have substantially worse outcomes than those with normal RDW, independent of disease severity scores.
Kidney disease outcomes are strongly predicted by RDW. Patients with chronic kidney disease who have elevated RDW show faster progression to kidney failure and higher mortality.
Why does RDW predict mortality so consistently? It’s likely not that variation in red blood cell size directly causes death. Rather, elevated RDW reflects underlying pathophysiology that increases mortality risk including chronic inflammation (inflammatory cytokines impair red blood cell production and create heterogeneous cell populations), oxidative stress (damages red blood cells and bone marrow function), nutritional deficiencies (iron, B12, folate deficiencies create mixed cell populations and reflect poor overall nutritional status), bone marrow dysfunction (impaired or dysregulated red blood cell production), and poor overall physiological reserve.
RDW essentially functions as a marker of biological aging and physiological stress. Higher RDW indicates a body under chronic stress producing less uniform red blood cells—a sign that fundamental cellular processes aren’t functioning optimally.
What RDW Reveals About Nutritional Status
One of the most clinically useful applications of RDW is identifying nutritional deficiencies, often before anemia develops.
The combination of RDW with MCV (mean corpuscular volume—average red blood cell size) creates a powerful diagnostic pattern that reveals specific deficiencies.
Normal RDW with low MCV (small cells, uniform size) suggests thalassemia trait—a genetic condition causing production of uniformly small red blood cells. The cells are all small, but they’re all the same size, so RDW remains normal. This pattern differentiates thalassemia trait from iron deficiency, which is critical because thalassemia doesn’t respond to iron supplementation and excessive iron can be harmful.
High RDW with low MCV (small cells, varied sizes) strongly suggests iron deficiency. As iron stores deplete, the body produces progressively smaller red blood cells. At any given time, you have older normal-sized cells still circulating (red blood cells live 120 days) alongside newly-produced small cells from iron-deficient production. This mixture creates high RDW. As iron deficiency progresses, RDW typically rises before MCV drops significantly and before anemia develops—RDW is an early warning signal.
High RDW with high MCV (large cells, varied sizes) suggests vitamin B12 or folate deficiency. B12 and folate are essential for DNA synthesis in rapidly dividing cells like red blood cell precursors. Deficiency causes production of abnormally large cells (macrocytic). Similar to iron deficiency, you have a mixture of older normal cells and newer abnormal large cells, creating high RDW. B12/folate deficiency also often involves some ineffective red blood cell production, creating additional size variation.
High RDW with normal MCV suggests mixed deficiencies—simultaneous iron deficiency (pulling MCV down) and B12/folate deficiency (pulling MCV up), resulting in “normal” average cell size despite underlying problems. RDW elevation reveals that something’s wrong even when MCV appears normal. This can also occur during treatment of deficiencies—as you correct iron or B12/folate deficiency, bone marrow produces new normal-sized cells that mix with older abnormal cells, creating high RDW during the recovery period.
Normal RDW with high MCV suggests chronic alcohol use, liver disease, certain medications (methotrexate, antivirals), or hypothyroidism. These conditions produce uniformly large cells rather than mixed populations.
Elevated RDW can be the first sign of nutritional deficiency before hemoglobin drops into the anemic range. Many people experience symptoms from iron or B12 deficiency (fatigue, cognitive impairment, reduced exercise capacity) when stores are depleted but before anemia develops. RDW elevation often precedes anemia, providing an opportunity for early intervention.
RDW and Inflammation
Chronic inflammation substantially affects RDW through multiple mechanisms, making it a useful marker of inflammatory burden.
Inflammatory cytokines (particularly IL-6, TNF-alpha, and others) interfere with iron metabolism and red blood cell production. Inflammation causes functional iron deficiency—adequate iron stores exist, but inflammatory signals prevent proper iron utilization for hemoglobin synthesis. This creates smaller, iron-poor red blood cells mixed with older normal cells, elevating RDW.
Inflammation also shortens red blood cell lifespan. Inflammatory environments damage red blood cell membranes, causing premature destruction. The bone marrow compensates by producing new cells faster, creating a mix of younger and older cells with different characteristics.
Oxidative stress associated with chronic inflammation damages both circulating red blood cells and bone marrow precursors, creating heterogeneous cell populations with increased RDW.
Conditions associated with chronic inflammation consistently show elevated RDW including cardiovascular disease (atherosclerosis is fundamentally an inflammatory process), rheumatoid arthritis and other autoimmune conditions, inflammatory bowel disease (Crohn’s disease, ulcerative colitis), chronic kidney disease, obesity (produces chronic low-grade inflammation), metabolic syndrome and insulin resistance, and chronic infections.
Studies examining RDW alongside inflammatory markers (hs-CRP, ESR, IL-6) show strong correlations. Elevated RDW often corresponds with elevated inflammatory markers. As inflammation is treated and markers like hs-CRP decline, RDW often improves over months as newer, healthier red blood cells replace older ones produced in the inflammatory environment.
RDW provides a readily available, inexpensive marker of chronic inflammation that’s included in every complete blood count. While it’s not as specific as markers like hs-CRP, its routine availability and strong prognostic associations make it valuable for identifying people with significant inflammatory burden.
RDW in Specific Disease States
Beyond mortality prediction and nutritional assessment, RDW provides diagnostic and prognostic information in specific conditions.
Heart failure patients show strong associations between RDW and outcomes. Multiple studies demonstrate that elevated RDW predicts hospitalization, disease progression, and mortality in both acute and chronic heart failure. RDW often outperforms established cardiac markers for outcome prediction. The mechanism likely involves chronic inflammation, poor nutritional status, bone marrow dysfunction from reduced cardiac output, and kidney dysfunction commonly present in heart failure.
Coronary artery disease and acute coronary syndrome (heart attack) show elevated RDW predicting major adverse cardiac events. Higher RDW at the time of heart attack predicts larger infarct size, more complications, and higher mortality. This might reflect baseline inflammatory burden, nutritional status affecting cardiac repair capacity, or overall physiological reserve.
Stroke outcomes correlate with RDW. Elevated RDW at stroke presentation predicts larger strokes, more severe neurological deficits, and higher mortality. Again, this likely reflects inflammatory status and overall health reserve rather than direct causation.
Chronic kidney disease shows RDW rising progressively as kidney function declines. This occurs through multiple mechanisms—erythropoietin deficiency (kidneys produce EPO; as kidney function declines, EPO production falls, impairing red blood cell production), chronic inflammation (kidney disease creates inflammatory state), functional iron deficiency from inflammation, and accumulation of uremic toxins affecting bone marrow function. Elevated RDW predicts progression to end-stage kidney disease and mortality in CKD patients.
Liver disease commonly elevates RDW through effects on red blood cell shape and membrane, alterations in lipid metabolism affecting cell membranes, nutritional deficiencies (particularly folate in alcohol-related liver disease), chronic inflammation, and splenic sequestration in patients with portal hypertension. Elevated RDW predicts complications and mortality in cirrhosis.
Diabetes shows associations between elevated RDW and complications. Diabetic patients with high RDW have increased risk of cardiovascular events, kidney disease progression, and mortality. The link likely involves chronic inflammation, oxidative stress from poor glucose control, and microvascular complications affecting multiple organs including bone marrow.
Pulmonary disease including COPD and pulmonary hypertension shows elevated RDW predicting exacerbations, hospitalizations, and mortality. Chronic hypoxia, inflammation, and right heart strain all likely contribute.
Anemia workup relies heavily on RDW patterns. The combination of RDW with MCV, hemoglobin, and other markers directs investigation toward specific causes and avoids unnecessary testing.
Normal vs. Optimal RDW
Standard reference range for RDW is approximately 11.5-14.5% (some labs use 11.5-15.0%).
This range is derived from populations that include many people with suboptimal nutrition, chronic diseases, and inflammatory conditions. “Normal” doesn’t mean “optimal.”
Optimal RDW for health and longevity:
11.5-13.5%, ideally 11.5-13.0%
Lower RDW indicates more uniform red blood cells, reflecting excellent nutritional status, minimal chronic inflammation, healthy bone marrow function producing consistent cells, and overall good physiological health.
RDW below 11.5% is very rare and not concerning—it simply indicates extremely uniform red blood cells. Some healthy people naturally have RDW around 11.0-11.5%.
RDW in the 13.5-14.5% range is technically “normal” but represents borderline elevation. This level suggests possible early nutritional depletion, mild chronic inflammation, or early stages of conditions that haven’t yet caused obvious abnormalities in other markers.
RDW above 14.5-15.0% is elevated and warrants investigation regardless of other blood count parameters. Even when hemoglobin, MCV, and other markers appear normal, elevated RDW indicates underlying problems and predicts adverse outcomes.
RDW above 16-17% suggests significant pathology—advanced nutritional deficiencies, substantial chronic disease burden, severe inflammation, or bone marrow dysfunction.
Important considerations for interpretation:
RDW can take 3-4 months to normalize after correcting underlying problems because red blood cells live about 120 days. When you correct iron deficiency or B12 deficiency, bone marrow immediately starts producing healthy cells, but older abnormal cells remain in circulation for months. RDW reflects the mixture and gradually improves as old cells are replaced.
RDW trends over time are valuable. Progressive RDW elevation over months to years suggests developing chronic disease, worsening nutritional status, or increasing inflammatory burden—even when still within “normal” range.
Age affects RDW—older adults typically have slightly higher RDW than younger adults, likely reflecting accumulated inflammatory burden and declining physiological reserve. However, this doesn’t mean elevated RDW in older adults should be dismissed as “normal for age.”
What Causes Elevated RDW?
Elevated RDW results from any process creating heterogeneous red blood cell populations—mixing cells of different sizes.
Iron deficiency is the most common cause of elevated RDW. As iron stores deplete, progressively smaller cells are produced and mix with older normal-sized cells. RDW often rises before MCV drops significantly, making it an early marker of iron deficiency. Ferritin below 30-50 ng/mL typically corresponds with elevated RDW even when hemoglobin is still normal.
Vitamin B12 and folate deficiencies create large cells that mix with older normal cells, elevating RDW. The deficiency must be significant enough to affect red blood cell production—mild deficiency might not elevate RDW, but moderate-to-severe deficiency consistently does.
Mixed nutritional deficiencies (iron plus B12/folate) create particularly elevated RDW because you’re producing both small cells (from iron deficiency) and large cells (from B12/folate deficiency) simultaneously, creating maximum heterogeneity. This can occur with malabsorption (celiac disease, inflammatory bowel disease), poor diet lacking multiple nutrients, or during recovery when one deficiency is corrected before another.
Chronic inflammation from any cause elevates RDW through functional iron deficiency, shortened red blood cell lifespan, oxidative damage to cells and bone marrow, and dysregulated red blood cell production. Common causes include cardiovascular disease, autoimmune conditions, chronic infections, inflammatory bowel disease, obesity, and metabolic syndrome.
Hemolysis (premature red blood cell destruction) elevates RDW because bone marrow produces new cells rapidly to replace those destroyed, creating a mix of young and old cells. Causes include autoimmune hemolytic anemia, genetic conditions (G6PD deficiency, hereditary spherocytosis), mechanical destruction, and certain medications.
Recent blood transfusion creates high RDW by mixing donor cells (which may have different characteristics) with your own cells. RDW normalizes over several months as transfused cells are cleared.
Bone marrow disorders can elevate RDW through dysregulated red blood cell production. Myelodysplastic syndromes, leukemias, and other conditions affecting bone marrow often produce heterogeneous red blood cell populations.
Chronic kidney disease elevates RDW through multiple mechanisms including erythropoietin deficiency causing ineffective production, chronic inflammation, functional iron deficiency, and uremic toxins affecting bone marrow.
Liver disease affects red blood cell membranes and production, creating heterogeneous populations and elevated RDW.
Alcohol use elevates RDW through direct toxic effects on bone marrow, folate deficiency, liver disease, and nutritional deficiencies common in alcohol use disorder.
Hypothyroidism can elevate RDW through effects on red blood cell production and metabolism.
Recent treatment of anemia creates temporarily elevated RDW as new healthy cells are produced and mix with older abnormal cells. This is expected during recovery and gradually normalizes.
How to Lower Elevated RDW
Lowering RDW requires addressing underlying causes. Since red blood cells live 120 days, improvements take months to fully manifest.
For iron deficiency (high RDW, low or low-normal MCV, low ferritin):
Increase dietary iron from heme sources (red meat, organ meats, shellfish) or non-heme sources (legumes, fortified grains, dark leafy greens) with vitamin C. Supplement iron if deficient—typical doses are 25-65 mg elemental iron daily, taken with vitamin C and away from calcium, coffee, or tea. Monitor ferritin—target 50-100 ng/mL or higher. Address underlying causes of iron deficiency—heavy menstruation, GI bleeding, malabsorption, or inadequate intake. RDW begins improving within 1-2 months of starting supplementation but takes 3-4 months to normalize fully.
For vitamin B12 or folate deficiency (high RDW, high MCV):
Optimize B12 intake from animal products or supplement 250-500 mcg daily minimum (vegans and vegetarians require supplementation). People with absorption issues may need 1000+ mcg daily or B12 injections. Target B12 above 400-500 pg/mL. Include adequate folate from leafy greens, legumes, fortified grains, or supplement 400-800 mcg daily. Address absorption issues—pernicious anemia, gastric surgery, celiac disease, inflammatory bowel disease, chronic PPI use. RDW improves over 2-4 months as new healthy cells replace deficient cells.
For chronic inflammation (high RDW with elevated hs-CRP or other inflammatory markers):
Address underlying inflammatory conditions through medical management of autoimmune disease, chronic infections, or inflammatory bowel disease. Reduce obesity-related inflammation through weight loss and improved body composition. Optimize diet to reduce inflammatory foods—minimize processed foods, excess omega-6 oils, refined carbohydrates, and added sugars. Increase anti-inflammatory foods—fatty fish, vegetables, fruits, nuts. Exercise regularly—consistent physical activity reduces systemic inflammation. Manage stress and optimize sleep—both affect inflammatory status. Target hs-CRP below 1.0 mg/L, ideally below 0.5 mg/L. As inflammation declines, RDW gradually improves over months.
For mixed causes:
Address all identified deficiencies and inflammatory conditions simultaneously. Comprehensive metabolic optimization—nutrition, exercise, sleep, stress management—improves multiple factors affecting RDW. Monitor progress every 3 months—RDW should show gradual improvement as old abnormal cells are replaced by new healthy cells.
General strategies for RDW optimization:
Ensure adequate protein intake for healthy red blood cell production—target at least 0.8-1.0 g/kg body weight, more for athletes. Consume adequate copper, zinc, and vitamins A, C, and E—all support healthy red blood cell production and antioxidant protection. Maintain excellent hydration for accurate measurement and optimal blood health. Manage chronic diseases effectively—diabetes, kidney disease, liver disease, and cardiovascular conditions all affect RDW. Review medications—some drugs affect red blood cell production or lifespan. Avoid excessive alcohol—damages bone marrow and depletes folate.
RDW and Cardiovascular Risk Assessment
Given RDW’s strong association with cardiovascular mortality, some researchers have proposed incorporating it into cardiovascular risk assessment.
Traditional cardiovascular risk calculators (Framingham, ASCVD) don’t include RDW, yet RDW often predicts events as well as or better than included markers. Studies show adding RDW to traditional risk scores improves risk stratification—identifying people at higher risk than traditional markers alone would suggest.
The mechanism linking RDW to cardiovascular risk likely involves chronic inflammation (RDW reflects inflammatory burden, which drives atherosclerosis), oxidative stress (damages both red blood cells and arterial walls), poor nutritional status (deficiencies affecting red blood cells also affect cardiovascular health), and overall physiological stress and biological aging (high RDW indicates reduced reserve capacity).
Practical cardiovascular risk assessment using RDW:
Someone with traditional risk factors (elevated LDL or ApoB, high blood pressure, diabetes) plus elevated RDW likely has higher true cardiovascular risk than calculators predict. The elevated RDW suggests chronic inflammation and oxidative stress accelerating atherosclerosis.
Someone with favorable traditional markers but elevated RDW might have hidden cardiovascular risk from inflammation or other processes not captured in standard lipid and blood pressure measurements. This person might benefit from measuring inflammatory markers (hs-CRP) and addressing chronic inflammatory conditions.
Monitoring RDW over time in people with cardiovascular disease provides prognostic information. Rising RDW suggests worsening inflammatory burden and physiological status, potentially indicating need for more aggressive risk factor management.
RDW should be considered alongside other markers in comprehensive cardiovascular risk assessment—not as a replacement for ApoB, hs-CRP, insulin resistance markers, and blood pressure, but as additional context revealing inflammatory and nutritional burden.
Frequently Asked Questions
What is a good RDW level?
Optimal RDW is 11.5-13.5%, ideally 11.5-13.0%. This indicates uniform red blood cells, excellent nutritional status, minimal chronic inflammation, and healthy bone marrow function. Standard “normal” range is 11.5-14.5%, but values above 13.5% suggest early problems even when technically normal. RDW above 14.5-15.0% is elevated and warrants investigation.
Can RDW be too low?
RDW below 11.5% is very rare but not concerning. It simply indicates extremely uniform red blood cells. Some healthy people naturally have RDW around 11.0-11.5%. There’s no known pathology associated with very low RDW—uniformity is desirable.
What does high RDW with normal hemoglobin mean?
High RDW with normal hemoglobin indicates early stages of nutritional deficiency before anemia develops, mixed nutritional deficiencies (iron plus B12/folate) balancing out to maintain hemoglobin, chronic inflammation affecting red blood cell production without yet causing anemia, or increased long-term health risk—studies show elevated RDW predicts mortality even when hemoglobin is normal. This pattern warrants investigation—check ferritin, B12, folate, and inflammatory markers (hs-CRP).
How long does it take to lower RDW?
RDW improvements take 3-4 months because red blood cells live about 120 days. When you correct iron or B12 deficiency, bone marrow immediately produces healthy cells, but older abnormal cells remain in circulation for months. You might see modest improvement (1-2% decline) within 6-8 weeks, but full normalization takes 3-4 months as old cells are completely replaced by new healthy cells.
Why is my RDW high when I’m not anemic?
RDW often rises before anemia develops. Iron stores can be depleted (low ferritin) with RDW elevation before hemoglobin drops. Early B12 deficiency can elevate RDW before severe anemia occurs. Chronic inflammation affects red blood cell production and elevates RDW without necessarily causing anemia. RDW is a more sensitive early marker than hemoglobin—it catches problems earlier.
Does inflammation always increase RDW?
Chronic inflammation typically increases RDW through functional iron deficiency, shortened red blood cell lifespan, oxidative damage, and dysregulated production. However, the relationship isn’t absolute—some people with elevated inflammatory markers maintain normal RDW, and not everyone with elevated RDW has measurably elevated hs-CRP. RDW reflects cumulative inflammatory burden over time (since red blood cells live 120 days) rather than acute inflammation.
Can RDW predict heart attack or stroke?
Multiple studies show elevated RDW predicts cardiovascular events including heart attack and stroke. The association is independent of traditional risk factors—RDW provides additional prognostic information beyond what lipids, blood pressure, and glucose reveal. However, RDW is a marker of risk, not a direct cause. You can’t simply lower RDW and expect cardiovascular protection—you need to address the underlying inflammation, nutritional deficiencies, or other factors causing both elevated RDW and increased cardiovascular risk.
Should I supplement iron if my RDW is high but ferritin is normal?
Not without identifying the cause of elevated RDW. If ferritin is adequate (above 50-100 ng/mL) but RDW is elevated, check B12 and folate (could be B12/folate deficiency rather than iron), inflammatory markers (chronic inflammation can elevate RDW despite adequate iron stores), and consider other causes. Iron supplementation when iron stores are adequate provides no benefit and can potentially cause problems. Always identify why RDW is elevated before supplementing.
Testing RDW With ApexBlood
ApexBlood’s comprehensive blood panel includes RDW as part of the complete blood count (CBC), along with all related markers necessary to understand what’s driving RDW elevation: hemoglobin, hematocrit, and RBC count for anemia assessment, MCV (mean corpuscular volume) to differentiate iron deficiency (low MCV) from B12/folate deficiency (high MCV), MCH and MCHC for hemoglobin content within cells, and platelets for overall bone marrow function.
Our testing also includes critical markers that reveal what’s causing RDW abnormalities: ferritin for iron storage status—low ferritin with high RDW indicates iron deficiency, vitamin B12 for DNA synthesis and red blood cell production, high-sensitivity C-reactive protein (hs-CRP) for inflammatory assessment, and complete metabolic markers to assess kidney and liver function affecting red blood cells.
This comprehensive approach reveals not just your RDW but the complete picture—whether elevated RDW is from iron deficiency (low MCV, low ferritin), B12/folate deficiency (high MCV, low B12), chronic inflammation (elevated hs-CRP), mixed deficiencies, or other causes requiring investigation.
RDW is meaningless in isolation. You need to know your MCV to determine cell size pattern, ferritin to assess iron status, B12 to evaluate B12 status, and hs-CRP to assess inflammation. You need to track RDW over time to see if it’s stable or changing.
Most doctors ignore RDW entirely because they don’t understand its significance. But research clearly shows it’s one of the most powerful prognostic markers in medicine—predicting mortality, cardiovascular events, and adverse outcomes across virtually every disease category.
You can’t optimize what you don’t measure. Stop accepting RDW results without understanding what they reveal about nutritional status, inflammation, and long-term health risk.
Get comprehensive testing including RDW and complete nutritional markers – $189
The Bottom Line on RDW
Red cell distribution width (RDW) measures variation in red blood cell size and is one of the most underutilized but powerful markers in medicine. Optimal RDW is 11.5-13.5%, ideally 11.5-13.0%. RDW above 14.5% warrants investigation even when hemoglobin and other markers appear normal.
Elevated RDW predicts all-cause mortality, cardiovascular events, cancer outcomes, sepsis mortality, and adverse outcomes across virtually every disease category studied. Higher RDW indicates chronic inflammation, nutritional deficiencies, oxidative stress, and reduced physiological reserve.
The combination of RDW with MCV reveals specific nutritional deficiencies. High RDW with low MCV indicates iron deficiency. High RDW with high MCV indicates B12 or folate deficiency. High RDW with normal MCV indicates mixed deficiencies, chronic inflammation, or other complex causes.
RDW is a sensitive early marker—it often rises before hemoglobin drops into anemic ranges, providing an opportunity for early intervention. RDW elevation with normal hemoglobin indicates early deficiency, chronic inflammation, or increased mortality risk that standard interpretation would miss.
Lowering elevated RDW requires addressing underlying causes—correcting iron deficiency, optimizing B12 and folate, reducing chronic inflammation, and comprehensive metabolic optimization. Improvements take 3-4 months as old abnormal cells are replaced by new healthy cells.
High performers track RDW as a marker of nutritional status, inflammatory burden, and overall biological health. They don’t dismiss it as “just another CBC number”—they recognize it as one of the most predictive markers available for long-term health and mortality risk.
Stop ignoring RDW when it’s one of the most powerful prognostic markers in your blood panel. Stop accepting “normal” when optimal is possible.
Medical Disclaimer: This information is for educational purposes and does not constitute medical advice. RDW elevation and related blood abnormalities require evaluation by qualified healthcare providers. Never make treatment decisions based solely on internet information. Always consult licensed medical professionals for diagnosis and treatment.