
Estimated Coronary Heart Disease Risk: What Your Number Actually Means
Your doctor tells you your cholesterol looks “fine” based on individual markers. Meanwhile, a calculated risk score suggests you have a 15% chance of a heart attack in the next decade. Which one should you believe?
Estimated coronary heart disease (CHD) risk is a calculated prediction of your probability of experiencing a major cardiac event—heart attack, stroke, or cardiovascular death—within a specific timeframe, typically 10 years. Unlike individual biomarkers that measure single variables, CHD risk scores integrate multiple risk factors into a composite assessment that attempts to predict your actual likelihood of cardiovascular catastrophe.
The problem? Most CHD risk calculators were developed from population studies of average, unhealthy Americans. They often miss critical risk factors, overestimate risk in healthy individuals with single elevated markers, and underestimate risk in metabolically dysfunctional people whose individual markers look “acceptable.”
High performers don’t make decisions based on population averages and outdated algorithms. They understand the science behind risk calculation, recognize its limitations, and use comprehensive metabolic assessment to understand their true cardiovascular vulnerability.
What Is Estimated Coronary Heart Disease Risk?
Estimated CHD risk is a percentage probability that you’ll experience a major cardiovascular event within a defined period. A 10% 10-year CHD risk means that if 100 people with your exact risk profile were followed for 10 years, approximately 10 would have heart attacks, strokes, or cardiovascular deaths.
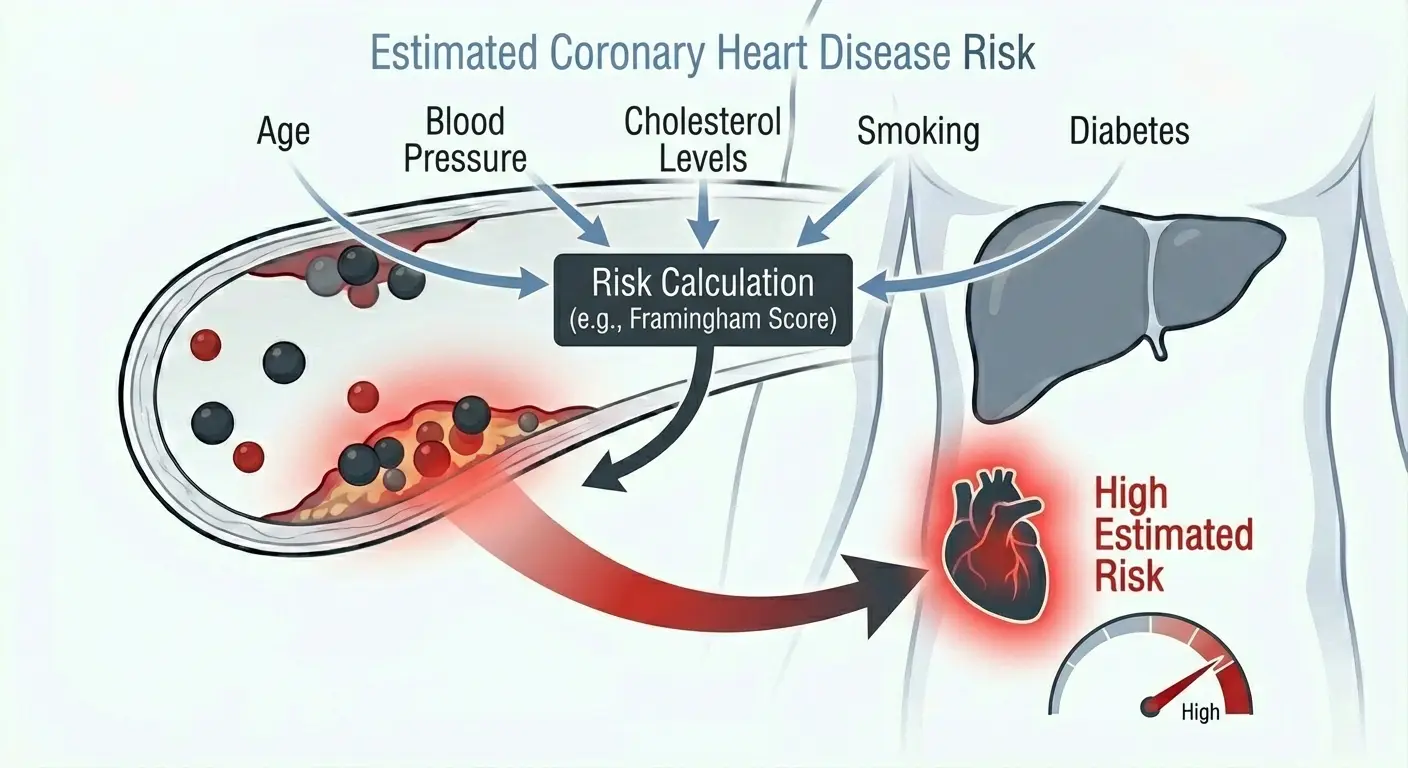
These risk estimates come from mathematical models built on large population studies like the Framingham Heart Study, which followed thousands of people for decades and tracked who developed cardiovascular disease. Researchers identified which factors predicted events, weighted them according to their predictive power, and created algorithms that calculate individualized risk based on your specific values.
The most commonly used risk calculators include the Framingham Risk Score (the original, developed from a predominantly white population in Massachusetts), the ASCVD Risk Calculator (American College of Cardiology/American Heart Association calculator used widely in clinical practice), Reynolds Risk Score (includes hs-CRP and family history), and QRISK (used in the UK, includes additional factors like ethnicity and chronic diseases).
These calculators typically incorporate age, sex, total cholesterol or LDL cholesterol, HDL cholesterol, blood pressure, smoking status, and diabetes status. More sophisticated versions include family history, inflammatory markers like hs-CRP, and ethnicity.
The output is a percentage risk over 10 years, categorized into risk groups that guide treatment recommendations. Low risk is typically below 5%, borderline risk is 5-7.5%, intermediate risk is 7.5-20%, and high risk is above 20%.
Medical guidelines use these risk categories to determine who should receive statins, aspirin, blood pressure medications, and other preventive interventions. If your calculated risk exceeds certain thresholds, guidelines recommend treatment even if individual biomarkers don’t seem dramatically elevated.
Why CHD Risk Calculators Matter (And Why They’re Flawed)
CHD risk calculators represent an attempt to move beyond treating individual biomarkers in isolation toward assessing overall cardiovascular vulnerability. This is conceptually sound. Cardiovascular disease is multifactorial—age, blood pressure, lipids, inflammation, metabolic health, and genetics all contribute. Looking at these factors together provides more accurate risk assessment than focusing on LDL cholesterol alone.
The calculators have been validated in large populations. People identified as high risk by these tools do have significantly more cardiovascular events than people identified as low risk. When used appropriately in the populations they were designed for, they provide reasonable risk stratification.
But here’s where it gets problematic.
Most CHD risk calculators were derived from populations that don’t represent metabolically healthy, performance-focused individuals. The Framingham Heart Study began in 1948 following middle-aged residents of Framingham, Massachusetts. Participants smoked heavily, had poor diets, didn’t exercise regularly, and developed diabetes and obesity at high rates. The “normal” represented in these datasets is pathologically unhealthy by modern performance standards.
The calculators can dramatically overestimate risk in people with single elevated markers but otherwise excellent metabolic health. Someone with LDL at 160 mg/dL but excellent HDL at 80 mg/dL, triglycerides at 60 mg/dL, no inflammation, excellent insulin sensitivity, and no family history gets flagged as “high risk” based on LDL alone. Their actual cardiovascular risk is likely far lower than the calculator suggests because their lipid particles are large and fluffy, not small and dense.
Conversely, the calculators can underestimate risk in metabolically dysfunctional individuals whose individual markers fall within “acceptable” ranges. Someone with LDL at 120 mg/dL, HDL at 35 mg/dL, triglycerides at 180 mg/dL, elevated hs-CRP, and insulin resistance might calculate as “low-intermediate risk” despite having highly atherogenic small, dense LDL particles and significant metabolic dysfunction.
The calculators don’t account for particle size or composition. LDL at 140 mg/dL composed of large, fluffy particles is treated identically to LDL at 140 mg/dL composed of small, dense particles, even though cardiovascular risk differs dramatically. This is where apolipoprotein B (ApoB) becomes critical—it counts actual atherogenic particles, not just cholesterol content.
Age dominates most risk calculators to the point where younger people with terrible metabolic health calculate as “low risk” while healthy older individuals calculate as “high risk” based almost entirely on age. A 35-year-old with insulin resistance, elevated ApoB, high inflammation, and terrible lipid particle composition might show 3% 10-year risk. A metabolically healthy 65-year-old with excellent markers except age might show 15% risk. Treating these identically is absurd.
Normal vs. Optimal CHD Risk
Standard risk categories according to most calculators:
Low risk: Below 5% 10-year risk
Borderline risk: 5-7.5% 10-year risk
Intermediate risk: 7.5-20% 10-year risk
High risk: Above 20% 10-year risk
Medical guidelines typically recommend aggressive intervention (statins, aspirin, blood pressure medications) once risk exceeds 7.5-10%, depending on the specific guideline and calculator used.
The problem with these categories is they’re based on when population-level interventions show statistical benefit in clinical trials, not on what represents truly optimal cardiovascular health for an individual focused on longevity and performance.
A 10% 10-year risk means 1 in 10 chance of cardiovascular catastrophe within a decade. For someone optimizing for longevity and peak performance, this isn’t “low risk”—it’s unacceptably high. Yet guidelines often categorize this as acceptable, requiring no intervention.
For performance-focused individuals optimizing for longevity, the target should be below 5% 10-year risk, ideally approaching 2-3% or lower. This requires comprehensive metabolic optimization, not just hitting population-based thresholds.
But here’s the critical nuance: the calculated percentage matters far less than the underlying biology driving the number. Two people with identical 8% calculated risk might have completely different cardiovascular vulnerabilities. One might have elevated risk purely from age and family history with otherwise excellent metabolic health. The other might have elevated risk from insulin resistance, inflammation, and atherogenic lipid particles despite younger age.
Optimal isn’t about getting your calculated risk below an arbitrary threshold. It’s about comprehensive metabolic optimization—excellent insulin sensitivity, low inflammation, favorable lipid particle composition (high HDL, low triglycerides, low ApoB, large LDL particles), healthy body composition, normal blood pressure without medication, and no metabolic dysfunction.
What Drives Your CHD Risk Score?
Understanding what factors contribute to calculated CHD risk helps you know which interventions actually reduce your true cardiovascular vulnerability versus just gaming the calculator.
Age is the dominant factor in most CHD risk calculators. Every additional year increases calculated risk, particularly after 45 for men and 55 for women. This reflects the reality that cardiovascular disease accumulates over decades. But it also means that calculators heavily penalize healthy older individuals while giving false reassurance to metabolically dysfunctional younger people.
Sex influences baseline risk. Men have higher cardiovascular risk at younger ages. Women’s risk increases significantly after menopause as protective estrogen declines. Most calculators adjust for sex and show lower calculated risk for women at the same age with identical risk factors.
Lipid markers drive a significant portion of calculated risk. Total cholesterol or LDL cholesterol increases calculated risk as levels rise. HDL cholesterol decreases calculated risk as levels rise—higher HDL is protective. The ratio between total cholesterol and HDL cholesterol or between LDL and HDL often matters more than absolute values. Critical limitation: these calculators use LDL cholesterol, not ApoB, meaning they miss the critical distinction between many small particles versus fewer large particles.
Blood pressure contributes substantially to CHD risk. Both systolic and diastolic pressure increase risk as they rise. Hypertension dramatically increases calculated risk. Some calculators distinguish between treated and untreated hypertension. The distinction matters because someone controlling blood pressure with multiple medications has different underlying pathology than someone with naturally low blood pressure.
Smoking status is one of the most powerful modifiable risk factors. Current smoking dramatically increases calculated risk. Former smoking shows intermediate risk. Never smoking provides the lowest risk. Quitting smoking is one of the most effective interventions for immediately reducing cardiovascular risk.
Diabetes status substantially increases calculated risk. Type 2 diabetes typically doubles or triples calculated CHD risk compared to non-diabetics with otherwise similar markers. This reflects the reality that diabetes causes widespread vascular damage, promotes atherogenic lipid particles, increases inflammation, and accelerates atherosclerosis. Prediabetes and insulin resistance aren’t directly captured in most calculators, which is a significant limitation—yet these conditions dramatically increase true cardiovascular risk.
Family history of premature cardiovascular disease (parents or siblings with heart attacks or strokes before age 55-60) increases risk in calculators that include this factor. Genetic predisposition matters enormously but is crudely captured (if at all) in most risk algorithms.
Inflammatory markers like hs-CRP are included in some calculators (Reynolds Risk Score) but not others (standard Framingham). Inflammation independently predicts cardiovascular events and provides critical context that lipid markers alone miss.
The Markers That Risk Calculators Miss
Here’s where understanding your true cardiovascular risk requires going beyond calculated scores.
Apolipoprotein B (ApoB) is the single best marker for atherogenic particle burden, as emphasized by longevity physicians like Peter Attia. Every atherogenic particle—VLDL, IDL, LDL—contains exactly one ApoB molecule. By measuring ApoB, you count actual particle number, not just cholesterol content. Studies consistently show ApoB predicts cardiovascular events better than LDL cholesterol, yet most CHD risk calculators use LDL cholesterol instead. This means the calculators miss critical information in the 20-30% of people where LDL and ApoB are discordant.
You can have “normal” LDL cholesterol but elevated ApoB (many small, atherogenic particles), or elevated LDL cholesterol but normal ApoB (fewer large particles). The former is more dangerous despite lower cholesterol numbers. When LDL and ApoB tell different stories, ApoB is the better predictor of who actually has cardiovascular events.
Insulin resistance and metabolic dysfunction drive small, dense LDL production, inflammation, and endothelial dysfunction. Insulin-resistant individuals have dramatically higher cardiovascular risk at any given LDL or calculated CHD risk score. Yet insulin resistance isn’t directly measured in standard risk calculators. Fasting insulin, hemoglobin A1c, and the triglyceride-to-HDL ratio provide this critical context.
Triglyceride-to-HDL ratio is one of the most powerful predictors of both insulin resistance and LDL particle size. Ratios above 3 indicate insulin resistance and small, dense LDL particles. Ratios below 1.5 suggest excellent insulin sensitivity and large, fluffy LDL particles. This single ratio often predicts cardiovascular risk better than any individual lipid marker, yet it’s not the primary focus of most calculators.
Advanced inflammatory markers provide cardiovascular risk context beyond what’s captured in standard calculators. High-sensitivity C-reactive protein (hs-CRP) independently predicts cardiovascular events and reveals whether arterial inflammation makes LDL particles more likely to penetrate vessel walls and oxidize. Optimal hs-CRP is below 1.0 mg/L, ideally below 0.5 mg/L. Elevated hs-CRP indicates dramatically higher cardiovascular risk even when lipid markers appear acceptable.
How Calculated Risk Influences Treatment Recommendations
Medical guidelines use CHD risk calculators to determine who receives preventive medications, particularly statins.
The typical algorithm: calculate 10-year ASCVD risk using the ACC/AHA calculator. If risk is below 5%, lifestyle modification without medication. If risk is 5-7.5%, consider statin based on individual discussion and other risk factors. If risk is 7.5% or higher, recommend statin therapy. If risk is above 20%, recommend high-intensity statin.
This algorithmic approach has some logic. It attempts to target preventive treatment to those most likely to benefit while avoiding medicating people at low absolute risk. Population-level data shows that statins reduce cardiovascular events in people calculated to be at higher risk.
But this approach has significant problems when applied to individuals rather than populations.
It can lead to aggressive treatment in people whose elevated calculated risk comes primarily from age despite excellent metabolic health. A healthy, fit 65-year-old with perfect lipid markers, low ApoB, no inflammation, excellent insulin sensitivity, and zero cardiovascular disease in their family might calculate at 12% risk based almost entirely on age and sex. Guidelines would recommend a statin. But their true biological risk might be far lower than the calculator suggests, and the benefit-risk calculation of taking a daily medication for decades becomes questionable.
It can fail to identify high-risk individuals whose calculated risk appears acceptable because individual markers fall within “normal” ranges despite terrible metabolic health. A 40-year-old with insulin resistance, elevated ApoB, high hs-CRP, atherogenic lipid particles, and strong family history might calculate at 6% risk. Guidelines might suggest observation without treatment. But their true cardiovascular risk could be substantially higher than the calculator indicates.
It treats all risk factors as equivalent when they’re not. Risk driven by modifiable metabolic dysfunction (insulin resistance, inflammation, atherogenic lipids) should be addressed through metabolic optimization first, not immediately medicated. Risk driven by non-modifiable factors (age, genetics, family history) might warrant earlier medication consideration.
It ignores the distinction between relative risk reduction and absolute risk reduction. Statins might reduce cardiovascular events by 25-30% relative risk reduction across populations. But if your absolute risk is 4%, a 25% reduction brings you to 3%—an absolute risk reduction of 1%. You’d need to take a statin daily for 10 years to have a 1% lower chance of cardiovascular catastrophe. For some people, that tradeoff makes sense. For others, particularly those experiencing side effects, it doesn’t.
Better approach: Use calculated CHD risk as one input among many, not as a definitive treatment trigger. Consider ApoB, hs-CRP, insulin markers, and metabolic health comprehensively. Assess whether elevated risk comes from modifiable metabolic dysfunction or non-modifiable factors. Evaluate absolute risk reduction from interventions, not just relative risk reduction. Consider individual values, preferences, and tolerance for medication side effects. For metabolically healthy individuals whose calculated risk comes primarily from age or single markers, comprehensive metabolic optimization might be more appropriate than immediate medication.
Improving Your True Cardiovascular Risk
Reducing calculated CHD risk is easy—just game the calculator by focusing on the markers it includes. Reducing your true cardiovascular risk requires comprehensive metabolic optimization.
Optimize lipid particle composition, not just lipid numbers. Lower ApoB below 90 mg/dL, ideally below 80 mg/dL—this counts actual atherogenic particle burden. Shift LDL particle distribution toward large, fluffy particles by lowering triglycerides below 100 mg/dL. Increase HDL above 60 mg/dL for men, above 70 mg/dL for women. Achieve triglyceride-to-HDL ratio below 2, ideally below 1.5. These targets indicate favorable particle composition and low atherogenic burden.
Eliminate insulin resistance and metabolic dysfunction. Achieve fasting insulin below 5 μIU/mL, ideally below 3 μIU/mL. Maintain hemoglobin A1c below 5.4%, ideally below 5.2%. Optimize body composition with minimal visceral fat. These interventions address the root cause of atherogenic lipid particle production and vascular inflammation.
Reduce systemic inflammation to levels that don’t promote atherosclerosis. Target hs-CRP below 1.0 mg/L, ideally below 0.5 mg/L. Address sources of chronic inflammation through diet, stress management, sleep optimization, and metabolic health. Inflammation determines whether LDL particles penetrate arterial walls and become oxidized.
Maintain healthy blood pressure without medication. Target blood pressure below 120/80 mmHg through lifestyle optimization, stress management, adequate potassium intake, and healthy body composition. Hypertension damages arterial walls and accelerates atherosclerosis.
Never smoke. If you currently smoke, quitting provides immediate and dramatic cardiovascular risk reduction. Smoking causes endothelial dysfunction, promotes inflammation, and accelerates atherosclerosis more than almost any other modifiable factor.
Exercise consistently with both aerobic training and resistance training. Regular exercise improves insulin sensitivity, raises HDL, improves LDL particle size distribution, lowers blood pressure, reduces inflammation, and provides cardiovascular benefits independent of effects on individual markers.
Maintain healthy body composition with minimal visceral fat. Visceral adiposity drives insulin resistance and inflammatory, atherogenic lipid particle production. Body composition matters more than total weight.
Understanding Risk in Context
Two people with identical 12% calculated 10-year CHD risk might have completely different true cardiovascular vulnerabilities.
Person A: 62-year-old man, LDL 145 mg/dL, ApoB 75 mg/dL, HDL 75 mg/dL, triglycerides 55 mg/dL, hs-CRP 0.4 mg/L, fasting insulin 2.5 μIU/mL, hemoglobin A1c 5.1%, blood pressure 115/72 mmHg, never smoked, exercises regularly, lean with minimal visceral fat, no family history of premature cardiovascular disease. Calculated risk: 12% (driven almost entirely by age). True risk: likely much lower than calculated—large LDL particles, low particle number, no inflammation, excellent metabolic health.
Person B: 52-year-old man, LDL 120 mg/dL, ApoB 115 mg/dL, HDL 38 mg/dL, triglycerides 185 mg/dL, hs-CRP 2.8 mg/L, fasting insulin 15 μIU/mL, hemoglobin A1c 5.8%, blood pressure 135/88 mmHg, former smoker, sedentary, significant visceral obesity, strong family history of early heart attacks. Calculated risk: 12%. True risk: likely much higher than calculated—small dense LDL particles, high particle number, significant inflammation, insulin resistance, genetic predisposition.
Treating these two identically based on calculated risk ignores fundamental differences in cardiovascular pathophysiology. Person A might benefit most from continued metabolic optimization without medication. Person B requires aggressive intervention addressing insulin resistance, inflammation, and atherogenic particles.
This is why comprehensive assessment including ApoB, hs-CRP, insulin, and hemoglobin A1c provides dramatically better risk stratification than calculated CHD risk alone.
Frequently Asked Questions
What is a good CHD risk score?
Standard guidelines define low risk as below 5% 10-year risk. But for individuals optimizing for longevity and performance, the target should be 2-3% or lower. More important than the calculated percentage is the underlying biology—low ApoB (below 80-90 mg/dL), excellent metabolic health, minimal inflammation (hs-CRP below 0.5-1.0 mg/L), and favorable lipid particle composition indicate low true cardiovascular risk regardless of calculated score.
Can you lower your CHD risk score?
Yes, though the question is whether you’re lowering calculated risk by gaming the calculator or lowering true cardiovascular risk through comprehensive metabolic optimization. Improving lipid markers (lowering LDL and triglycerides, raising HDL), reducing blood pressure, quitting smoking, and addressing diabetes all lower calculated risk. More importantly, reducing ApoB, eliminating insulin resistance, minimizing inflammation (measured by hs-CRP), and optimizing body composition reduce true cardiovascular vulnerability even when calculated risk doesn’t change dramatically.
How accurate are CHD risk calculators?
CHD risk calculators provide reasonable population-level risk stratification—people calculated as high risk do have more cardiovascular events than people calculated as low risk. But accuracy for individuals is limited. Calculators miss critical factors like ApoB (actual particle burden), insulin resistance (measured by fasting insulin and hemoglobin A1c), and comprehensive inflammation assessment. They can overestimate risk in metabolically healthy individuals with single elevated markers and underestimate risk in metabolically dysfunctional people whose individual markers appear acceptable.
Should I take a statin based on my CHD risk score?
Calculated CHD risk should be one input in treatment decisions, not the sole determinant. Consider your ApoB, not just LDL cholesterol—if ApoB is elevated (above 90-100 mg/dL), intervention is more clearly warranted. Assess whether elevated risk comes from modifiable metabolic dysfunction (elevated insulin, hemoglobin A1c, hs-CRP) or non-modifiable factors like age and genetics. Evaluate absolute risk reduction from statins, not just relative risk reduction. Consider potential side effects and their impact on quality of life. For people with established cardiovascular disease or very high ApoB, statins have clear benefit. For healthy people with moderately elevated calculated risk but excellent metabolic health, the decision is more nuanced.
Why is my CHD risk high when my cholesterol is normal?
CHD risk calculators integrate multiple factors. Your risk might be elevated due to age (the dominant factor in most calculators), high blood pressure, smoking status, diabetes, or low HDL even when LDL appears “normal.” This highlights a key limitation of focusing on individual markers rather than comprehensive risk assessment. Conversely, calculated risk might appear acceptable despite underlying metabolic dysfunction if you’re young enough that age hasn’t yet dominated the calculation.
Does losing weight lower CHD risk?
Weight loss, particularly loss of visceral fat, typically lowers calculated CHD risk by improving lipid markers (lowering triglycerides and LDL, raising HDL), reducing blood pressure, and improving glucose metabolism (lowering hemoglobin A1c and fasting insulin). More importantly, losing visceral fat reduces true cardiovascular risk by eliminating insulin resistance, reducing inflammation (hs-CRP), and shifting lipid particle production away from atherogenic small, dense particles (lowering ApoB). The cardiovascular benefits of healthy body composition often exceed what calculated risk scores predict.
What’s more important: my LDL number or my CHD risk score?
Neither alone tells the complete story. Your ApoB (atherogenic particle number) matters more than LDL cholesterol. Your metabolic health (insulin sensitivity measured by fasting insulin and hemoglobin A1c, inflammation measured by hs-CRP) matters more than calculated risk scores derived from population averages. Comprehensive assessment including ApoB, hs-CRP, insulin markers, and metabolic health provides far better cardiovascular risk stratification than either LDL or calculated CHD risk alone.
Can you have high CHD risk with normal labs?
Yes, particularly if you’re older (age dominates most calculators) or have risk factors like smoking, hypertension, or diabetes that aren’t reflected in standard lipid panels. Also, “normal” labs can hide significant problems—LDL at 120 mg/dL might be composed of many small, dense atherogenic particles (high ApoB) rather than fewer large particles. This is why comprehensive testing including ApoB, hs-CRP, insulin, and hemoglobin A1c reveals risk that standard panels miss.
Testing CHD Risk With ApexBlood
ApexBlood’s comprehensive blood panel includes all markers necessary to calculate standard CHD risk scores: total cholesterol, LDL cholesterol, HDL cholesterol, triglycerides, and lipid ratios including cholesterol/HDL ratio, LDL/HDL ratio, and estimated coronary heart disease risk.
More importantly, our testing includes critical markers that standard CHD risk calculators miss: apolipoprotein B (ApoB) for actual atherogenic particle burden, high-sensitivity C-reactive protein (hs-CRP) for inflammation assessment, fasting insulin for insulin resistance evaluation, hemoglobin A1c for glucose metabolism assessment, and complete blood count markers (hemoglobin, hematocrit, RBC, platelets, RDW) that provide additional cardiovascular context.
This comprehensive approach allows you to see both your calculated CHD risk and the underlying biological factors driving that risk. You’ll understand whether elevated calculated risk comes from modifiable metabolic dysfunction or non-modifiable factors, whether your lipid markers reflect many small atherogenic particles or fewer large particles, and whether inflammation and insulin resistance are accelerating cardiovascular risk beyond what traditional calculations reveal.
Understanding cardiovascular risk requires more than a percentage from a population-based calculator. It requires comprehensive metabolic assessment that reveals your true biological vulnerabilities and guides intelligent optimization rather than reflexive treatment.
You can’t optimize what you don’t measure. Stop relying on oversimplified risk scores when comprehensive testing reveals the complete cardiovascular picture.
Get comprehensive testing including ApoB – $189
The Bottom Line on CHD Risk
Estimated coronary heart disease risk calculators attempt to integrate multiple risk factors into composite risk assessment, which is conceptually superior to focusing on individual markers in isolation. People calculated as high risk do have more cardiovascular events than people calculated as low risk at the population level.
But these calculators were derived from unhealthy populations, miss critical risk factors like ApoB and insulin resistance, can dramatically overestimate risk in metabolically healthy individuals, and underestimate risk in metabolically dysfunctional people whose individual markers appear acceptable.
Your calculated CHD risk is one data point. Your true cardiovascular risk depends on atherogenic particle burden (measured by ApoB, not just LDL cholesterol), lipid particle composition (large fluffy particles versus small dense particles, inferred from triglycerides and HDL), inflammatory status (hs-CRP), insulin sensitivity and metabolic health (fasting insulin and hemoglobin A1c), and overall metabolic function.
Two people with identical calculated risk can have dramatically different true cardiovascular vulnerabilities. One might have elevated risk purely from age despite excellent biology. The other might have elevated risk from insulin resistance, inflammation, and atherogenic particles despite younger age.
High performers don’t make decisions based on population-averaged calculators that miss critical biology. They test comprehensively, understand their true cardiovascular vulnerabilities, and optimize metabolically rather than just treating numbers.
Stop accepting oversimplified risk calculations when comprehensive metabolic assessment reveals what’s actually happening in your cardiovascular system. Stop accepting “normal” when optimal is possible.
Medical Disclaimer: This information is for educational purposes and does not constitute medical advice. Cardiovascular risk assessment and management require evaluation by qualified healthcare providers. Never make treatment decisions based solely on internet information. Always consult licensed medical professionals for diagnosis and treatment.