
LDL/HDL Ratio: Understanding Context Beyond Individual Cholesterol Numbers
Your LDL cholesterol is 140 mg/dL. Your doctor immediately suggests a statin. But your HDL is 80 mg/dL and your triglycerides are 65 mg/dL. Should you be treated the same as someone with LDL at 140 mg/dL, HDL at 35 mg/dL, and triglycerides at 200 mg/dL?
Absolutely not. Yet this happens every day in conventional medical practice.
The LDL/HDL ratio provides critical context that individual cholesterol numbers miss. It reveals the balance between atherogenic particles (measured more directly by LDL cholesterol and best measured by ApoB) and markers of metabolic health. It helps distinguish between people whose elevated LDL reflects high atherogenic particle burden versus those whose elevated LDL occurs alongside favorable metabolic patterns.
This isn’t about dismissing LDL or ApoB as risk factors—atherogenic particle burden matters enormously. It’s about understanding that cardiovascular risk depends on the complete metabolic picture, not single numbers in isolation.
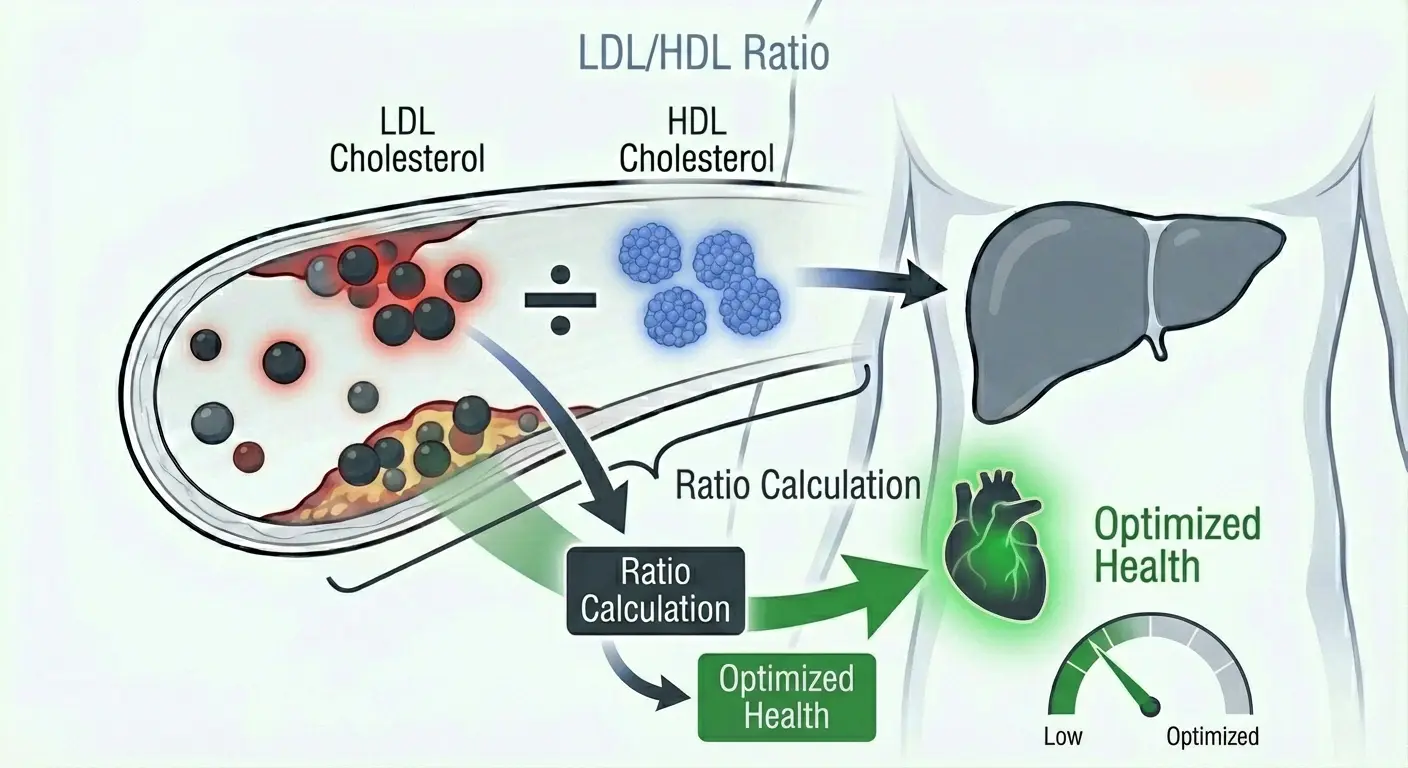
What Is the LDL/HDL Ratio?
The LDL/HDL ratio is exactly what it sounds like: your LDL cholesterol divided by your HDL cholesterol. If your LDL is 120 mg/dL and your HDL is 60 mg/dL, your ratio is 2.0.
This simple calculation provides more cardiovascular risk information than either number alone. Large cohort studies including Framingham, the Physicians’ Health Study, and INTERHEART consistently show that LDL/HDL ratio and total cholesterol/HDL ratio predict cardiovascular events better than LDL cholesterol alone.
Why does a ratio work better than individual numbers? Because cardiovascular disease isn’t just about atherogenic particles—it’s about the metabolic environment those particles exist in. The ratio captures some of that context in a single number.
Low LDL/HDL ratios typically reflect favorable metabolic health—good insulin sensitivity, low triglycerides, lower atherogenic particle burden (as measured by ApoB), and reduced inflammation. High LDL/HDL ratios typically reflect metabolic dysfunction—insulin resistance, high triglycerides, high atherogenic particle burden, and increased inflammation.
This is why the ratio often outperforms LDL alone in predicting who actually has heart attacks and strokes.
Why LDL/HDL Ratio Matters for Risk Assessment
Traditional cardiovascular risk assessment focuses heavily on LDL cholesterol. If LDL exceeds certain thresholds (typically 130-160 mg/dL depending on guidelines), treatment gets recommended regardless of metabolic context.
This approach misses critical information.
LDL cholesterol measures the amount of cholesterol carried in LDL particles. But it doesn’t tell you how many particles you have (that’s ApoB), what size they are (inferred from triglycerides), or what metabolic environment they’re circulating in (reflected partly in HDL and triglycerides).
The LDL/HDL ratio helps fill some of these gaps, though it’s important to understand what it reveals and what it doesn’t.
A low LDL/HDL ratio (below 2.0-2.5) often coexists with favorable metabolic patterns including lower atherogenic particle number (ApoB typically lower), larger LDL particle size (triglycerides typically lower), better insulin sensitivity, and reduced systemic inflammation. People with low ratios tend to have lower cardiovascular risk even when LDL cholesterol appears moderately elevated.
A high LDL/HDL ratio (above 3.5-4.0) strongly correlates with metabolic dysfunction including higher atherogenic particle number (ApoB typically elevated), smaller, denser LDL particles (triglycerides typically elevated), insulin resistance, and increased inflammation. People with high ratios have substantially elevated cardiovascular risk even when LDL cholesterol appears only moderately elevated.
Here’s the critical nuance: the ratio is a useful risk stratifier, but it’s a proxy for what really matters—atherogenic particle burden (best measured by ApoB) and metabolic health. When you have access to ApoB, it provides superior risk assessment. When you don’t, ratios help capture some of what ApoB would reveal.
Understanding the Science: What the Ratio Actually Reflects
The LDL/HDL ratio correlates with cardiovascular risk because it reflects underlying metabolic patterns, not because the ratio itself is the causal mechanism.
HDL cholesterol reflects metabolic health and reverse cholesterol transport capacity, but raising HDL pharmacologically does not reduce cardiovascular events. This is a critical distinction that modern evidence has clarified. Multiple large trials of medications that dramatically raised HDL (CETP inhibitors and others) failed to reduce heart attacks and strokes. Mendelian randomization studies show that genetically high HDL does not reduce cardiovascular risk.
What this means: High HDL typically coexists with favorable metabolic health, lower triglycerides, and often lower ApoB—this metabolic pattern lowers risk. But HDL itself is not the protective mechanism. It’s a marker of favorable metabolism, not a modifiable therapeutic target.
Similarly, the “large, fluffy LDL” discussion needs careful framing. Particle size matters less than particle number. Small, dense LDL particles are dangerous primarily because their presence reflects high particle number (elevated ApoB). Large LDL particles with low ApoB represent lower risk. But large LDL particles with high ApoB still cause atherosclerosis—size doesn’t override the importance of total atherogenic particle burden.
The real value of the LDL/HDL ratio is that it often reflects the same metabolic patterns that drive atherogenic particle production. High ratios correlate with insulin resistance, elevated triglycerides, high ApoB, and small dense LDL. Low ratios correlate with insulin sensitivity, low triglycerides, lower ApoB, and larger LDL particles.
But correlation isn’t causation. The ratio is a useful proxy when better markers aren’t available. It’s not superior to directly measuring what actually matters—atherogenic particle number via ApoB.
Normal vs. Optimal LDL/HDL Ratio
Standard reference ranges for LDL/HDL ratio:
Optimal: Below 2.0
Good: 2.0-3.0
Borderline: 3.0-4.0
High risk: Above 4.0
Some guidelines suggest different cutoffs, with targets below 2.5 or 3.0 depending on the source. The exact thresholds matter less than understanding the patterns they reflect.
The problem with population-based “normal” ranges is they’re derived from unhealthy populations. The average American has insulin resistance, elevated triglycerides, and poor metabolic health. “Normal for the population” isn’t the same as “optimal for performance and longevity.”
For individuals optimizing for metabolic health and cardiovascular longevity, target LDL/HDL ratio below 2.0, ideally below 1.5-2.0. This typically reflects excellent metabolic health—low triglycerides, good insulin sensitivity, and favorable atherogenic particle profiles.
But here’s the crucial caveat: you can’t optimize the ratio in isolation. Gaming the ratio by artificially raising HDL (which doesn’t work long-term and doesn’t reduce cardiovascular risk) misses the point entirely. The goal is comprehensive metabolic optimization that naturally produces favorable ratios alongside low ApoB, low inflammation, and excellent insulin sensitivity.
What Drives Your LDL/HDL Ratio?
Understanding what creates favorable versus unfavorable ratios reveals what you actually need to optimize.
Insulin resistance is the primary driver of unfavorable LDL/HDL ratios. Insulin resistance increases hepatic VLDL production (which becomes LDL), promotes production of small dense LDL particles, lowers HDL through increased clearance, and elevates triglycerides. This metabolic cascade creates high LDL/HDL ratios even when absolute LDL isn’t dramatically elevated. Improving insulin sensitivity through weight loss, exercise, and metabolic optimization naturally improves the ratio by addressing root causes.
Triglyceride levels directly influence both LDL particle characteristics and HDL levels. High triglycerides (above 150 mg/dL) correlate with small dense LDL particles, lower HDL cholesterol, and higher LDL/HDL ratios. Low triglycerides (below 100 mg/dL) correlate with larger LDL particles, higher HDL, and lower LDL/HDL ratios. The triglyceride-to-HDL ratio is one of the best cheap proxies for insulin resistance—ratios above 3 strongly suggest insulin resistance, while ratios below 1.5 suggest excellent insulin sensitivity.
Body composition and visceral fat significantly impact the ratio. Excess visceral adiposity drives insulin resistance, inflammatory cytokine production, increased hepatic VLDL/LDL production, and reduced HDL. Losing visceral fat improves insulin sensitivity and naturally improves lipid ratios. Body composition matters more than total weight—someone with significant muscle mass and minimal visceral fat will have more favorable ratios than someone at the same weight with low muscle and high visceral fat.
Diet influences the ratio through multiple mechanisms. Excess refined carbohydrates and sugar drive insulin resistance, elevate triglycerides, promote small dense LDL production, and lower HDL. Trans fats from partially hydrogenated oils dramatically worsen lipid profiles and should be completely eliminated. Saturated fat effects vary significantly between individuals—some people’s LDL rises substantially (hyper-responders) while others show minimal change, and effects on HDL and the overall ratio depend on metabolic context.
Exercise improves LDL/HDL ratios through metabolic benefits. Both aerobic and resistance training improve insulin sensitivity, modestly raise HDL (typically 5-10%), modestly lower LDL, lower triglycerides, and improve overall metabolic health. The ratio improvement from exercise reflects comprehensive metabolic benefits, not just lipid changes.
Genetics plays a significant role in baseline ratios. Some people naturally produce more or less LDL, have genetically higher or lower HDL, or respond differently to dietary factors. Familial hypercholesterolemia causes very high LDL from birth due to defective LDL receptors. Genetic variants affecting HDL metabolism create variation in baseline HDL levels. Understanding genetic contributions helps distinguish modifiable from non-modifiable factors.
Age and sex influence the ratio. LDL typically increases with age while HDL remains relatively stable or declines slightly, worsening ratios. Women typically have higher HDL than men at the same age, producing more favorable ratios. After menopause, women’s LDL increases significantly while HDL often declines, substantially worsening ratios.
The Hierarchy of Cardiovascular Risk Markers
Understanding where the LDL/HDL ratio fits in the hierarchy of cardiovascular risk assessment is critical.
Tier 1 (Best): Apolipoprotein B (ApoB) or LDL particle number. These directly count atherogenic particles. Each VLDL, IDL, and LDL particle contains exactly one ApoB molecule, so measuring ApoB tells you how many atherogenic particles you actually have in your bloodstream. If you can only measure one thing, measure ApoB.
Tier 2: Non-HDL cholesterol (total cholesterol minus HDL cholesterol). This captures all atherogenic particles’ cholesterol content in a single number and often correlates well with ApoB.
Tier 3: Lipid ratios including LDL/HDL ratio, total cholesterol/HDL ratio, and triglyceride/HDL ratio. These are useful proxies when better markers aren’t available. They capture important metabolic context and often predict risk better than LDL alone.
Tier 4: LDL cholesterol alone. This is the least informative when used in isolation because it doesn’t distinguish between many small particles versus fewer large particles, doesn’t account for metabolic context, and misses critical risk information in a significant percentage of people.
The LDL/HDL ratio is valuable, but it’s a proxy for what actually drives cardiovascular risk. When you have ApoB available, it provides superior risk assessment. When you measure both ApoB and ratios, ApoB wins for determining true atherogenic burden.
This doesn’t mean ratios are useless—they’re not. They provide important metabolic context and work well when better markers aren’t available. But understanding the hierarchy prevents overreliance on ratios when more direct measurements exist.
LDL/HDL Ratio and Metabolic Dysfunction
One of the most valuable applications of the LDL/HDL ratio is identifying metabolic dysfunction before it becomes clinically obvious.
High LDL/HDL ratios (above 3.5-4.0) strongly correlate with insulin resistance, elevated triglycerides (often above 150 mg/dL), high atherogenic particle number (elevated ApoB), small dense LDL particles, increased systemic inflammation, and metabolic syndrome. These patterns often emerge before fasting glucose or hemoglobin A1c cross diagnostic thresholds for prediabetes or diabetes.
This early warning signal matters enormously. By the time fasting glucose reaches 100-125 mg/dL (prediabetes range) or hemoglobin A1c reaches 5.7-6.4%, insulin resistance has been present for years. The LDL/HDL ratio often deteriorates much earlier, providing an opportunity to intervene before metabolic damage becomes severe.
Someone with LDL at 140 mg/dL, HDL at 35 mg/dL (ratio 4.0), and triglycerides at 200 mg/dL likely has significant insulin resistance, elevated ApoB (probably above 100-110 mg/dL), predominantly small dense LDL particles, and substantially elevated cardiovascular risk—even if their fasting glucose is still “normal” at 95 mg/dL.
This person needs comprehensive metabolic optimization—weight loss if overweight, carbohydrate reduction, exercise, stress management, and possibly metabolic interventions—not just a statin prescription that lowers LDL without addressing underlying dysfunction.
Conversely, someone with LDL at 140 mg/dL, HDL at 80 mg/dL (ratio 1.75), and triglycerides at 60 mg/dL likely has good insulin sensitivity, lower ApoB (probably below 90 mg/dL despite elevated LDL cholesterol), predominantly large LDL particles, and lower cardiovascular risk despite the same LDL number.
These two scenarios require completely different approaches. Treating them identically based solely on LDL cholesterol would miss major differences in underlying risk and appropriate intervention.
How to Improve Your LDL/HDL Ratio
Improving the ratio requires comprehensive metabolic optimization, not gaming individual numbers.
Address insulin resistance as the primary driver of unfavorable ratios. Lose excess body fat, particularly visceral fat, through caloric deficit and strength training to preserve muscle mass. Reduce refined carbohydrates and added sugars that drive insulin resistance and elevate triglycerides. Exercise regularly with both aerobic training and resistance training to improve insulin sensitivity. Optimize sleep—poor sleep dramatically worsens insulin sensitivity. Manage chronic stress, which elevates cortisol and impairs insulin sensitivity.
Optimize dietary patterns to support metabolic health. Emphasize whole, unprocessed foods over refined and processed options. Include adequate protein to support satiety and muscle maintenance. Prioritize fiber from vegetables, fruits, legumes, and whole grains. Minimize or eliminate trans fats completely. Consider individual responses to saturated fat—some people benefit from reduction, others show minimal change. Focus on overall dietary pattern rather than obsessing over individual nutrients.
Build muscle and improve body composition. Muscle is metabolically active tissue that improves insulin sensitivity. Resistance training builds muscle while improving glucose disposal and insulin function. Higher muscle mass relative to fat mass improves metabolic health independent of total weight.
Don’t attempt to artificially raise HDL. Pharmacologically raising HDL doesn’t reduce cardiovascular risk. Focus instead on metabolic health improvements that naturally optimize HDL alongside other beneficial changes. HDL is a marker of favorable metabolism, not a target to chase in isolation.
Monitor comprehensive markers, not just ratios. Track ApoB for actual atherogenic particle burden. Monitor fasting insulin and hemoglobin A1c for insulin sensitivity. Check hs-CRP for inflammation. Assess triglycerides and triglyceride-to-HDL ratio for metabolic context. The goal is comprehensive metabolic optimization, not just hitting a ratio target.
Understanding Ratio Limitations
The LDL/HDL ratio is useful but has important limitations you need to understand.
The ratio can’t distinguish between different causes of the same number. A ratio of 3.0 could result from LDL at 150 mg/dL and HDL at 50 mg/dL, or from LDL at 120 mg/dL and HDL at 40 mg/dL. These scenarios might reflect different metabolic patterns and risk profiles that the ratio alone doesn’t capture.
The ratio doesn’t directly measure atherogenic particle burden. Two people with identical ratios can have very different ApoB levels. Someone with ratio 2.0 (LDL 140 mg/dL, HDL 70 mg/dL) might have ApoB at 75 mg/dL (low risk) or ApoB at 100 mg/dL (higher risk) depending on particle composition. The ratio provides context but doesn’t replace direct particle measurement.
Genetic factors can create exceptions to typical patterns. Some people with familial hypercholesterolemia have very high LDL from defective receptors, creating high ratios despite good metabolic health otherwise. Some people have genetically low HDL but excellent insulin sensitivity and low ApoB. The ratio works best for identifying metabolic dysfunction but can be misleading in people with specific genetic lipid disorders.
Very low LDL can create misleadingly “good” ratios. Someone with LDL at 60 mg/dL and HDL at 40 mg/dL has a ratio of 1.5, which appears excellent. But their low HDL might reflect metabolic dysfunction, and their very low LDL might be from aggressive statin therapy that’s masking underlying problems. The ratio looks good but doesn’t tell the complete metabolic story.
LDL/HDL Ratio vs. ApoB: What to Prioritize
When you have access to both markers, how should you think about them?
ApoB is the superior marker for atherogenic burden. It directly counts particles rather than measuring cholesterol content. It predicts cardiovascular events better than LDL cholesterol or ratios. When ApoB and ratios disagree, ApoB provides more accurate risk assessment. If you can only measure one thing, measure ApoB.
Use ratios to provide metabolic context. Even when you have ApoB, ratios reveal important information about insulin resistance, metabolic health, and the environment those particles exist in. Someone with ApoB at 90 mg/dL, high LDL/HDL ratio (4.0), high triglycerides (180 mg/dL), and low HDL (35 mg/dL) has different risk and requires different interventions than someone with ApoB at 90 mg/dL, low ratio (1.8), low triglycerides (70 mg/dL), and high HDL (70 mg/dL).
The ideal approach: Measure ApoB for atherogenic particle burden, check ratios for metabolic context, assess insulin markers (fasting insulin, hemoglobin A1c) for metabolic health, and monitor hs-CRP for inflammation. This comprehensive assessment reveals both particle burden and the metabolic environment driving risk.
If you don’t have access to ApoB, ratios are the next best option. They capture important risk information that LDL alone misses and often identify metabolic dysfunction early. But understand they’re proxies for more direct measurements, not replacements.
Treatment Implications: When Ratios Change Decisions
Understanding ratios should influence treatment decisions, particularly regarding statin prescriptions.
Someone with LDL at 155 mg/dL might reflexively receive a statin prescription based on guidelines. But if their HDL is 80 mg/dL (ratio 1.9), triglycerides are 65 mg/dL, ApoB is 75 mg/dL, insulin is normal, and hs-CRP is 0.4 mg/L, their true cardiovascular risk is likely much lower than LDL alone suggests. They might benefit more from continued metabolic optimization than immediate medication.
Conversely, someone with LDL at 125 mg/dL might be told they’re “fine.” But if their HDL is 32 mg/dL (ratio 3.9), triglycerides are 195 mg/dL, ApoB is 110 mg/dL, insulin is elevated, and hs-CRP is 2.5 mg/L, they’re at substantially higher cardiovascular risk requiring intervention—likely metabolic optimization first, possibly medication if ApoB remains elevated despite lifestyle changes.
This is precision medicine versus population-based algorithms. Use comprehensive assessment to understand individual risk rather than treating everyone with LDL above X identically.
Important caveat: Statins reduce cardiovascular risk by lowering ApoB regardless of HDL or ratios. Someone with elevated ApoB benefits from statins even if metabolic health isn’t perfect. Statins don’t fix metabolic dysfunction, but they do reduce cardiovascular events by lowering atherogenic particle burden. The decision should be based on ApoB and comprehensive risk assessment, not on attempting to achieve perfect metabolic health before considering medication.
Frequently Asked Questions
What is a good LDL/HDL ratio?
Optimal is below 2.0, ideally below 1.5-2.0. This typically reflects favorable metabolic health—good insulin sensitivity, low triglycerides, and lower atherogenic particle burden. Standard guidelines suggest below 2.0-3.0 depending on the source. More important than the specific ratio is what it reflects—comprehensive metabolic health including low ApoB, low triglycerides, low inflammation, and good insulin sensitivity.
Can I improve my ratio by taking HDL-raising supplements?
No, and you shouldn’t try. Artificially raising HDL doesn’t reduce cardiovascular risk—multiple large trials have proven this. Focus instead on metabolic health improvements (insulin sensitivity, weight loss, exercise, reducing triglycerides) that naturally optimize HDL alongside other beneficial changes. HDL is a marker of favorable metabolism, not a target to manipulate in isolation.
Is LDL/HDL ratio more important than LDL cholesterol alone?
The ratio provides better risk prediction than LDL alone in most populations because it captures metabolic context that LDL misses. But neither is as important as ApoB, which directly measures atherogenic particle burden. The hierarchy: ApoB is best, ratios are useful proxies when ApoB isn’t available, LDL alone is least informative.
Why is my ratio high when my LDL isn’t that elevated?
High ratios with moderate LDL typically reflect low HDL, which often indicates insulin resistance, elevated triglycerides, and metabolic dysfunction. Your ApoB is likely elevated despite moderate LDL cholesterol, meaning you have many small particles rather than fewer large particles. This scenario often carries higher cardiovascular risk than the LDL number alone suggests.
Can I have a good ratio but still be at high cardiovascular risk?
Yes. Someone with familial hypercholesterolemia can have very high LDL (200+ mg/dL) with decent HDL (60 mg/dL), creating a ratio around 3.3 that might seem borderline. But their extremely high LDL and ApoB create substantial cardiovascular risk requiring aggressive treatment. Similarly, very low LDL from medication can create a good ratio that masks underlying metabolic dysfunction. This is why comprehensive assessment including ApoB matters.
Should I refuse a statin if my ratio is good?
Not necessarily. The decision should be based on ApoB and comprehensive cardiovascular risk assessment, not ratios alone. Someone with a good ratio but elevated ApoB (above 90-100 mg/dL), established cardiovascular disease, or very high genetic risk may still benefit from statin therapy. Statins reduce events by lowering ApoB regardless of HDL or ratios. Discuss with your physician based on complete risk profile.
How quickly can I improve my LDL/HDL ratio?
Dietary and lifestyle changes can improve ratios within 4-8 weeks as insulin sensitivity improves, triglycerides fall, and HDL rises modestly. Weight loss produces gradual improvements over months. Exercise shows benefits within 2-3 months of consistent training. The timeline depends on baseline metabolic health and adherence to interventions. Focus on sustainable changes that improve comprehensive metabolic health, not quick fixes.
Does the ratio matter if my ApoB is normal?
Yes, for different reasons. If ApoB is normal (below 80-90 mg/dL) but your ratio is poor due to low HDL and high triglycerides, this suggests metabolic dysfunction that increases cardiovascular risk through mechanisms beyond atherogenic particles—inflammation, insulin resistance, endothelial dysfunction. Addressing this metabolic dysfunction improves overall health even when particle burden isn’t dramatically elevated.
Testing LDL/HDL Ratio With ApexBlood
ApexBlood’s comprehensive blood panel includes all markers necessary to calculate LDL/HDL ratio: LDL cholesterol, HDL cholesterol, and the calculated ratio itself.
More importantly, our testing includes the critical markers that reveal what the ratio actually reflects: apolipoprotein B (ApoB) for actual atherogenic particle burden, triglycerides and VLDL cholesterol for lipid metabolism assessment, total cholesterol/HDL ratio for additional risk context, fasting insulin for insulin resistance evaluation, hemoglobin A1c for glucose metabolism assessment, and high-sensitivity C-reactive protein (hs-CRP) for inflammation.
This comprehensive approach allows you to see both your ratios and what’s actually driving them—particle burden via ApoB, metabolic health via insulin and hemoglobin A1c, and inflammation via hs-CRP.
Understanding your LDL/HDL ratio in isolation tells an incomplete story. Understanding it alongside ApoB, insulin markers, triglycerides, and inflammation reveals your true cardiovascular risk profile and guides intelligent optimization.
You can’t optimize what you don’t measure. Stop relying on single cholesterol numbers when comprehensive testing reveals the complete metabolic picture.
Get comprehensive testing including ApoB – $189
The Bottom Line on LDL/HDL Ratio
The LDL/HDL ratio provides valuable cardiovascular risk information that LDL cholesterol alone misses. Large cohort studies consistently show ratios predict events better than LDL in isolation because they capture important metabolic context.
But the ratio is a proxy for what actually drives cardiovascular risk—atherogenic particle burden (best measured by ApoB) and metabolic dysfunction (assessed through insulin resistance markers, triglycerides, and inflammation). When you have access to ApoB, it provides superior risk assessment. When you don’t, ratios help capture some of what ApoB would reveal.
The current evidence hierarchy: ApoB or LDL particle number is best for measuring atherogenic burden. Non-HDL cholesterol is second. Lipid ratios are useful proxies. LDL cholesterol alone is least informative.
High LDL/HDL ratios strongly correlate with insulin resistance, elevated triglycerides, high atherogenic particle number (elevated ApoB), and increased cardiovascular risk. Low ratios often reflect favorable metabolic health, lower particle burden, and reduced risk. But correlation isn’t causation—the ratio reflects metabolic patterns, it’s not the protective or harmful mechanism itself.
HDL is a marker of metabolic health, not a therapeutic target. Raising HDL pharmacologically doesn’t reduce cardiovascular events. The goal is comprehensive metabolic optimization that naturally produces favorable ratios alongside low ApoB, low inflammation, and excellent insulin sensitivity.
High performers don’t optimize single numbers or ratios in isolation. They measure comprehensively (ApoB, ratios, insulin markers, inflammation), understand what drives their individual risk, and optimize metabolically based on complete biological assessment.
Stop accepting oversimplified single-number risk assessment when comprehensive testing reveals the complete picture. Stop accepting “normal” when optimal is possible.
Medical Disclaimer: This information is for educational purposes and does not constitute medical advice. Cardiovascular risk assessment and lipid management require evaluation by qualified healthcare providers. Never make treatment decisions based solely on internet information. Always consult licensed medical professionals for diagnosis and treatment.